Bridging the Academia-Industry Divide
I enjoy speaking with industry folks about the behavioral sciences, but it’s often frustrating — and it’s not their fault.
While I sit and listen to well-educated and thoughtful individuals extol the benefits of using framing effects to boost organ donation rates or anchoring to secure a better price in a negotiation, I often think about some of the fascinating research from the past decade that they haven’t even heard about. I think about the number of times I read a relatively unknown journal article and thought “just wait until Amazon learns about this…” or the see a social problem that could in some way benefit from research locked away in academic databases.
The laws of human behavior are being rewritten in a handful of PhD classrooms around the world. Academics are making discoveries about decision making, social behavior, and motivation that can meaningfully improve lives. But it will most likely take a decade, and probably two, before the average interested individual will even hear about them.
Why?
Why do findings about core human behavior often take so long to filter into industry? Here we can borrow from neoclassical economics: to understand the behavior, follow the incentive structure.
Professors are incentivized for the lifelong privilege of tenure by publishing original research — and not by repackaging decades-old research into pop psychology business books. For supplemental income, it’s much safer and easier to do one-off consulting projects. Plus, since many of the behavioral sciences involve open-ended theories (i.e., no proofs as in economics), authoring a book with practical implications is exceedingly difficult. You can’t fault academics for not translating their research for a broader audience when the incentive structure does not encourage it.
Example: The Jam Study
Consider the “jam study”, which demonstrated that more choices leads to fewer purchases, by Sheena Iyengar at Columbia and Mark Lepper at Stanford. Iyengar conducted the study in the mid-1990s while still a graduate student, and due to the slow pace of academic research and peer review, her findings were not published until 2000. However, the jam study has only recently entered the industry consciousness. Even the New York Times editorialized in 2010: “There is a famous jam study (famous, at least, among those who research choice)…” One might point out that now, over a decade and a half later, even psuedo-news sources cover the jam study, but the fifteen year lag between academia and industry still remains a moat too wide for many of us to bridge.
Solutions
How do we tighten the cycle between academic discovery and industry discussion? Unfortunately, I don’t have a great answer just yet. However, the recent and sustained popularity of Dan Ariely might be evidence that private academics can bridge the public consciousness gap. While public thought leaders must write about interesting topics in order to sell copies, necessarily leaving behind countless avenues of interesting research, Dan Ariely’s fame is outliving the launch of each of his books. This trend is some promise that figures like Dan will serve as a vehicle for transmitting research into reality.
What Monkeys Teach us about Facebook
Old World Monkeys and Social Structures
While the modern human Homo sapiens sapiens subspecies evolved from the ancestors of Old World monkeys (e.g., baboons, rhesus macaques) approximately twenty-five million years ago, many of our modern social behaviors are remnants of our evolutionary past. All primates, both human and non-human, live in social groups that sustain life by promoting cooperation and group cohesion. In fact, all social animals arrange themselves into groups with non-random structures that influence cooperative social behavior, including mating, food gathering, patterns of association, and social learning. The importance of group structures gives rise to a dominant supporting behavior: primates constantly act to maintain long term relationships.
Grooming as Relationship Maintenance
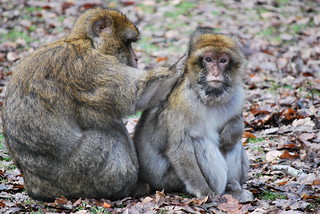
 In non-human primates, grooming is the primary behavior to maintain social relationships. Grooming typically involves reciprocated sessions, often temporally distinct, in which one monkey combs the hair of another to remove parasites. In addition to its anti-parasitic benefits, grooming plays a larger sociopositive role as the most fundamental form of social intercourse — it is related to fighting and dominance, reproductive behavior, and kin relations. Grooming typically mirrors the group hierarchy, so the despotic alpha male directs and receives the most grooming. Overall, public sociopositive grooming behavior, which monkeys observe and track, plays an integral role in creating and maintaining primate social structures.
Facebook as Modern Grooming
While grooming is the primary primate sociopositive behavior, no single action inhabits that role for humans. Privacy, expense, and researcher sanity considerations make longitudinal human interactions difficult to observe. However, Facebook provides an interesting set of structured and generally authentic data that parallels monkey grooming. Facebook enables individuals to maintain relationships, indicate public approval, and broadcast one’s affect to one’s group of friends. Is Facebook the modern equivalent to grooming?
Social Network Analysis
Social network analysis is one method particularly useful in understanding social structures of groups due to its ability to describe networks in terms of relationship properties and patterns. Techniques from this field have been used to investigate social behavior in a variety of species, including buffalo, elephants, dolphins, and fish. Both monkey grooming and Facebook status likes and comments have several structural commonalities that enable the social analytic approach: the behavior indicates public dyadic appropriation among individuals, and the reciprocal relationships encapsulated in dyads help maintain social relationships, including perceived hierarchy and rank.
Methods
Human
I used the Facebook API to scrape twenty-five status updates with likes and comments from over 100 individuals (anonymized) in my network. I coded each like or comment as one directed link from an individual to another, and constructed an egocentric network for all individuals in the network using Pajek. (Pajek is easier to use for quick network explorations than R.) After removing myself from the data set, the resulting network was comprised of vertices (nodes) representing individuals and arcs representing the interaction strength between each individual (M = 2.17, SD = 2.30, MIN = 1, MAX = 18). I extracted the largest component for comparison with the primate data.
Primate
I assembled the primate social network from an academic paper with detailed observational data about the grooming behavior of free-ranging rhesus macaques (Macaca mulatta) on the island of Cayo Santiago, Puerto Rico, a population still used today in comparative cognition research. Rhesus macaques are so similar to humans that 60-70% of all National Institutes of Health grants involving primates use this species. I coded the directed dyadic grooming behavior for all sixteen monkeys, represented as vertices, and the collective grooming duration as the arc strength (M = 6.10, SD = 10.36, MIN = 1, MAX = 63).
Analysis
Descriptive Measures and Network Density
Since primate and human social systems differ in size and density, I focused on the quality of network structure and the constituent relationships. Descriptive measures of each network are listed below. The Facebook data had fewer nodes (vertices) than the monkey data (11 vs. 16), and there were fewer directed ties between nodes in the Facebook data (35 vs. 110). These differences lead to two important considerations about the underlying type of data collected and the nature of the types of interactions that produced these networks. While the monkey data was representative of the sum total of interactions that occurred between all actors in a fixed population, the Facebook data represents a slice of one type of interaction of one subgroup of a population. At the same time, while grooming behavior is the primary form of reciprocal behavior in primate networks, Facebook status liking and commenting are just one of many forms of this type of behavior for humans.
Network density is a measure of the proportion of actual arcs relative to possible arcs. The monkey network was 50% more dense than the Facebook network, thus indicating more links between individuals.
| Measure | Monkey | |
| Vertices | 11 | 16 |
| Arcs | 35 | 110 |
| Density | 0.29 | 0.43 |
| Density w/o loops | 0.318 | 0.46 |
| Average degree | 6.36 | 13.75 |
| All closeness centralization | 0.43 vs. 0.27 | 0.27 vs. 0.24 |
| Betweenness centralization | 0.27 vs. 0.14 | 0.11 vs. 0.03 |
| All degree centralization | 0.406 vs. 0.10 | 0.24 vs. 0.12 |
| Watts-Strogatz Clustering Coefficient | 0.53 vs. 0.29 | 0.60 vs. 0.44 |
| Network Clustering Coefficient (Transitivity) | 0.45 vs. 0.30 | 0.56 vs. 0.44 |
All measures of Facebook and monkey network data (“vs.” expected values)
Centrality: Betweenness, Closeness, and Degree
The three primary measures of centrality — betweenness, closeness, and degree — indicate the importance of a node in a network based on structural positioning.
Betweenness centrality is a topological distance metric that reports the extent to which nodes lie on directed paths between other nodes. Nodes that lie on the shortest paths between others have higher betweenness centrality scores. In general, nodes with high betweenness scores have more control over information or behavioral flows. In humans, individuals with high betweenness centrality transmit norms, cultural knowledge, and behaviors to others in the network. The Facebook network had a betweenness centrality score more than twice than expected in a network of comparable structure (0.27 vs. 0.14). The monkey network had a betweenness centrality score three times greater than expected (0.11 vs. 0.03). The presence of significantly higher betweenness centrality scores in both networks indicates a hierarchical composition, and the greater betweenness centrality in the monkey data supports the notion that individual roles are more clearly defined and obeyed in primate social hierarchies. The alpha monkey had the highest betweenness centrality score.
Closeness centrality is the distance between nodes, and indicates the speed of interaction between nodes. In effect, nodes with the highest betweenness centrality scores are able to easily monitor others in the network. The monkey network had a closeness centrality score only slightly higher than expected (0.27 vs. 0.24). However, the closeness centrality score of the Facebook network was 60% higher than expected (0.43 vs. 0.27), meaning that individuals in the Facebook network were significantly more closely connected with each other than in a similar statistical network.
Degree centrality measures the overall connectedness of the network by looking at the number of arcs connected to each node. Degree centrality in the Facebook network was more than four times greater than expected (0.41 vs. 0.10), which indicates that the Facebook data was much more connected than a random network. The monkey network had a degree centrality score that was roughly twice than expected (0.24 vs. 0.12).
Clustering
The network clustering coefficient measures the magnitude of adjacency between individual nodes. This local measure provides a means of understanding the extent to which subgroups exist in a network, which is particularly important in understanding affiliative interactions. The clustering coefficient for the Facebook data was nearly twice than expected (0.53 vs. 0.29), whereas the monkey network clustering coefficient was only a third larger than expected (0.60 vs. 0.44). The larger than expected clustering in the monkey network points is evidence of cliques.
Triadic Census
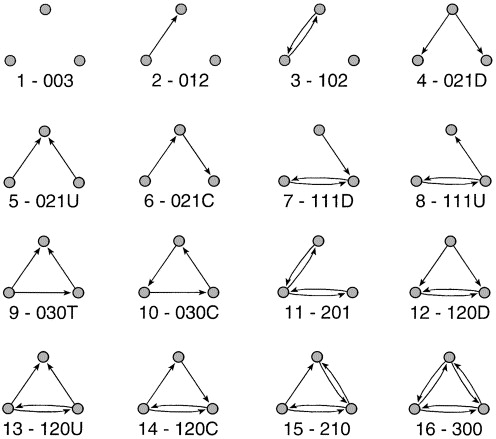
One tool to understand the patterns of connections between individual nodes in a network is the triadic census. Directed links between three vertices are called triads, and these links can be organized into sixteen distinct combinations (below). The prevalence of each triad, represented as the number found in a network relative to the expected number based on the number of arcs and nodes, provides valuable information about the underlying structure of a network.

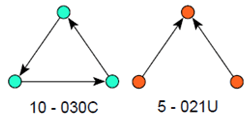
Triadic modes overrepresented in both networks
|
|
| Triadic modes overrepresented in the Facebook network 
|
Triadic models interestingly underrepresented
|
Visual triad representations (De Nooy, Mrvar & Batagelj, 2005)
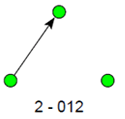
According to balance theory, individuals seek consistent relations among connections and act to reduce the number of intransitive triads. There are two types of triads that are prohibited in balanced networks: forbidden triads – in which A has two friends B and C, where B and C are not friends with each other, identified as 201 – and transitive triads, in which triads are at different hierarchical levels, identified as 012. A balanced network should have fewer triads classified as 201 or 012, because stable networks require symmetry. Both networks exhibited more 201 forbidden triads than expected, and the monkey network showed significantly more 012 transitive triads. Perhaps the greater ratio of found to expected triads in the Facebook network (7:1) versus the monkey network (2:1) indicates that Facebook networks are less “real” in the sense that relationships that should not exist are relatively prevalent. The presence of many non-permissible transitive networks (012, 210) indicates a tendency towards hierarchy. On the other hand, the overrepresentation of the 300 type triad — individuals in the same clique with complete mutual reciprocal influence — in both networks indicates that more balance than normal. In fact, the Facebook and monkey networks were 35 and 7 times more reciprocal than expected. The combination of balanced reciprocity, intransitivity, and hierarchy point to similar network structures that are hierarchical in global structure but have intra-level balance.
The absence of specific triad models is also interesting. Most notably, there was an underrepresentation of 021 triads, in which two nodes have unidirectional links to a single third node. This triad would represent a situation in which two monkeys groom a single monkey, but receive no grooming in return. It would have been surprising if this type of triad were frequent in either network, given the reciprocity inherent in both social behaviors. Similarly, the 030 triad model — in which each node is unidirectionally linked to exactly one other node — was also underrepresented. This triadic model of indirect reciprocity would be antithetical to the public signaling inherent in both monkey grooming and Facebook status liking.
Conclusions & Thoughts
So, what can monkeys teach us about Facebook? At least in this brief analysis, we can uncover striking similarities and important differences between rhesus macaque grooming and Facebook likes and comments networks:
- Grooming and Facebook networks show significantly higher levels of reciprocity than a statistically similar network.
- The grooming network demonstrated a higher hierarchical structure than the Facebook network.
- The grooming network demonstrated less connectedness than the Facebook status network.
The coexistence of balanced but hierarchical triads is a particularly puzzling outcome of the analysis. An analysis of intra-level cliques would provide a closer look at how different hierarchies interact and the relative strength of the ties within hierarchies. Similarly, only the alpha male node was identified in this data set, but there are important structural differences based on the age of each actor. Understanding the correlates between structural position and monkey age could point to underlying variations in how different genders and ages are included into social fabric of a primate colony. A similar comparison could be conducted with individuals joining social groups, with a time-series analysis offering a structural view at this process. Collecting this sort of data would require an enormous amount of behavioral observation, but future research in this area might yield answers to interesting questions about the primitivity of prosocial networks.
